pi-enviro: A Local Dashboard for the Enviro+ Sensors
What The Enviro+ Actually Measures
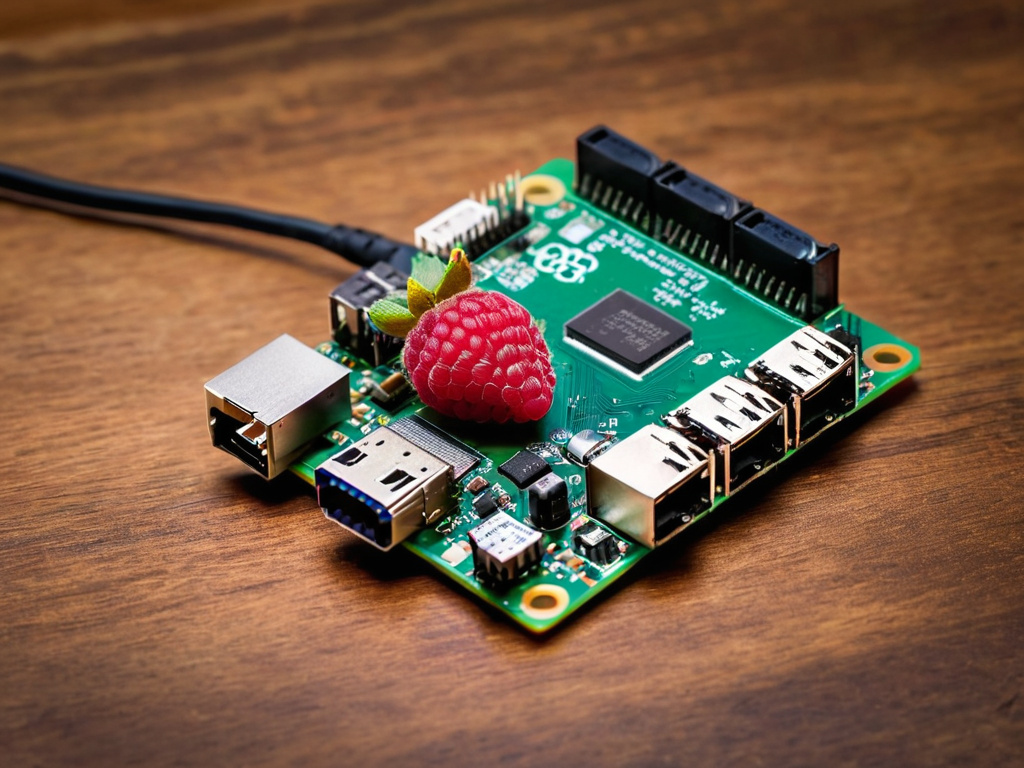
Pimoroni's Enviro+ is a HAT for the Raspberry Pi with a genuinely useful set of sensors on one board:
- BME280 — temperature, humidity, barometric pressure
- LTR-559 — light level and proximity
- MICS6814 — oxidising, reducing and NH3 gases (air quality, roughly)
- MEMS microphone — noise level
That is indoor environmental monitoring in a single board for the price of a couple of coffees. What it does not ship with is anywhere to put the readings, or any way to see them as a trend rather than a number.
This is the gap I filled: a small local dashboard, no cloud account, no subscription.
Why Local, Not Cloud
Every solution I found wanted either a monthly fee or my data uploaded to someone's platform. For indoor sensor data, both are unnecessary — the Pi is already a computer with a network connection and enough storage for years of readings at a readable interval.
Local also means the thing keeps working when the internet does not, and that nothing changes under you when a vendor reworks their pricing.
The code is at github.com/LukeKeam/pi-enviro.
The Architecture, Which Is Deliberately Boring
Three pieces:
1. A reader. A Python script that samples the sensors on a timer and writes rows to a database. Mine runs every minute. The Enviro+ libraries handle the sensor buses; the script is mostly a loop and an insert.
2. A store. SQLite on the Pi. One table, one row per reading, a timestamp plus the sensor columns. It is a single file, it needs no server process, and a year of one-minute samples is a few hundred megabytes — perfectly manageable.
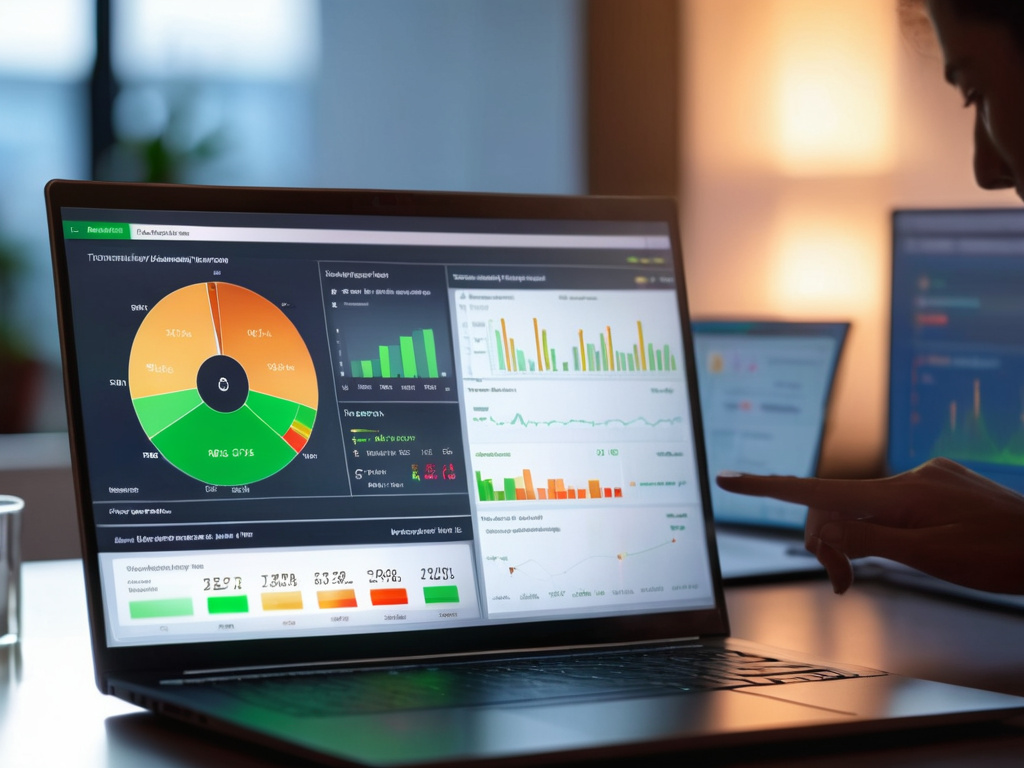
3. A viewer. A lightweight web page that queries the database and draws the recent history as charts, served by a small web server on the Pi and reachable from any browser on the LAN.
Nothing here is clever, and that is the point. It is three small things that each fail in obvious ways.
Setting It Up
Broadly:
# Pimoroni's Enviro+ libraries
sudo apt install python3-pip
pip3 install enviroplus
# follow Pimoroni's installer for the BME280/LTR-559 dependencies

git clone https://github.com/LukeKeam/pi-enviro
cd pi-enviro
pip3 install -r requirements.txt
Then start the reader, and point a browser at the Pi's address on the port the viewer listens on. The repository README carries the current commands, which is where this should live rather than being copied here where it will drift.
The Two Things That Will Bite You
The SD card. Writing a row every minute is 1,440 writes a day, and SD cards do not enjoy that forever. Two mitigations, both worth doing:
- Keep the database in WAL mode and batch commits rather than committing per sample.
- Back the database up somewhere else on a schedule — a nightly
sqlite3 .backupto a USB drive or a network share is enough.
Losing a month of temperature readings is not a disaster, but discovering the card has gone read-only after a year of collecting is annoying.
Sensor self-heating. The Pi's processor warms the air immediately around the board, so the BME280 reads a couple of degrees above room temperature, more if the case is closed. Pimoroni sells a small fan shim for exactly this. Without one, treat absolute temperature as indicative and the trend as reliable.
What The Data Is Actually Good For
Two uses, in order of value.
Trends over weeks. Air quality in a room I share with a laser printer turns out to be measurably worse in the afternoons. CO2 and VOC proxies will tell you when to open a window, which is a more useful daily decision than it sounds.
Correlating with something else. Noise levels against time of day. Humidity against whether the bathroom extractor fan is working. Temperature against the heating schedule. The dashboard becomes an instrument rather than a novelty.
What it is not good for: any claim about the air outside, and any comparison between rooms on different days. The cheap gas sensors drift and need calibration, so treat the absolute numbers with scepticism and the changes as the signal.
Build Your Own Instead
The reason this exists is that I could not find a free local version, so if you would rather not use mine, the pieces are all standard: enviroplus, SQLite, and any charting library. A Grafana instance pointed at the SQLite file is about twenty minutes of work and gives you far better graphs than mine does.
Don't trust the download button. Trust the hash.
If this was useful, More hands-on tech guides at TechGeek. No pressure — read it whenever it's useful.
