cycling-stats.com — running a season of club race results without spreadsheets
Most cycling clubs run their season in the same place I used to: a spreadsheet, an email chain, and one person who quietly owns the job of typing results in at 9pm on a Saturday night. The data isn't complicated on paper — riders, races, grades, points. It compounds fast in practice. Multiply N riders by M races by three or four categories per event, add points systems and primes, and by mid-season you're looking at live standings that are really just a pile of SUMIFs nobody fully trusts.
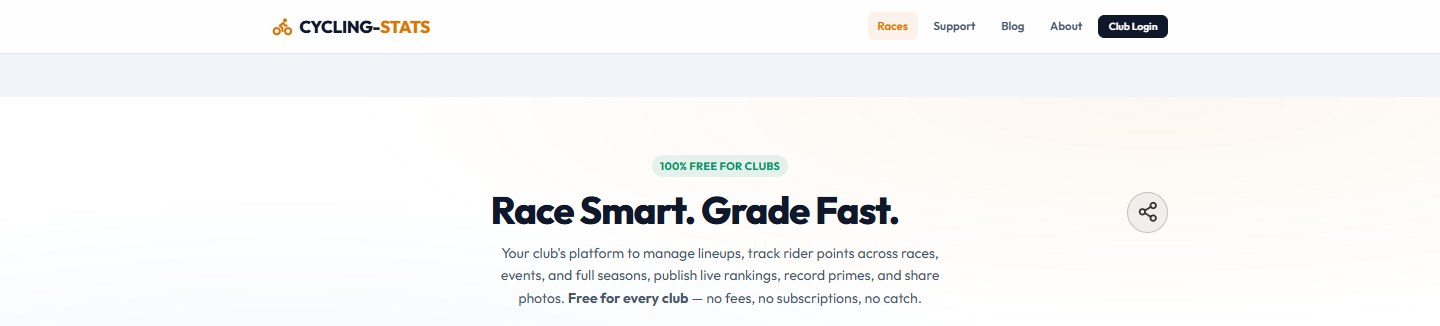
cycling-stats.com is the platform I built to take that job off the club's hands: line-ups, race results, and per-category season standings, published live as the day happens. It's 100% free for clubs. Here's how the thing is actually modelled under the hood, because the data problem is more interesting than it looks.
Why the spreadsheet dies
A season of club racing is a small database wearing a costume:
- Results arrive dirty. A photo of the race director's screen, a CSV with one column misaligned, or "hey, can you fix John's time?". The file needs a human in the loop every single weekend.
- Versions multiply.
results_v3_FINAL_actual.xlsxis not a joke format. By October nobody knows which file is canonical, and the person who does know is the club's single point of failure. - Number plates are a constraint solver. Clubs own their numbers — often with per-grade lists (Men A on 1–10, Women A on 21–30). "Who's got 7 this weekend?" gets asked every race day, and the answer lives in someone's head.
- Standings are an aggregation nobody wants to do by hand. Event standings, then season standings per category, updated after every event, with a rider who DNF'd in three races ranked correctly against one who finished 40th in all of them.
None of that is hard individually. It's the combination — and keeping it consistent across a 15-race season — that spreadsheets are bad at.
The data model
The site is a self-hosted Django project: one app, Postgres, Docker on a home server. The model layer is deliberately boring — nine tables, and most of them are just the nouns of a race day:
| Model | What it holds |
|---|---|
Athlete |
A rider: name, current club, optional AusCycling ID (imported from the line-up CSV) |
ClubTeam |
Club profile, logo, number plates (1-15, 18, 20-22), public vanity URL at /club/<name>/ |
Category |
A grade — global defaults plus club-scoped extras like U19 or Club A |
Season |
e.g. 2026-27; events belong to a season, so season standings stay scoped |
Event |
Name, type (road / track / crit / TT), course, dates, entry open/close window |
Race |
One race inside an event — "Men A Road Race", "Women A Crit" |
EventAthleteList |
The line-up: who's entered, in which grade |
RaceResult |
Position, points, time/gap, primes, status — unique per (race, rider, category) |
EventPhoto |
The event photo gallery |
The one design decision that makes the rest work: points live on the race result, and standings are never stored. Event and season standings are aggregated from RaceResult, per rider and category, every time a page renders. The entire ranking is one sort:
sorted(
    agg.items(),
    key=lambda kv: (-kv[1]['total'], kv[0].last_name.lower(), kv[0].first_name.lower()),
)
Total points descending, ties broken by surname then first name — because a standings table with two riders in the same position is a row of phone calls you don't want to field.
No stored aggregates means no drift: fix a result and every standings page that includes it updates, event-level and season-level, with no "recalculate" button and no stale cache to chase. The per-race breakdown columns on the season table are just the same results grouped differently.
What a race day actually looks like
The day-of flow is what the model is for. A club admin opens the event, pastes in the line-up (CSV import reads the AusCycling ID from the ID column), and riders who come in without a number get auto-assigned the next free plate from the club's list — or from the per-grade list, if the club keeps those separate. No more "wait, who's got 7?"
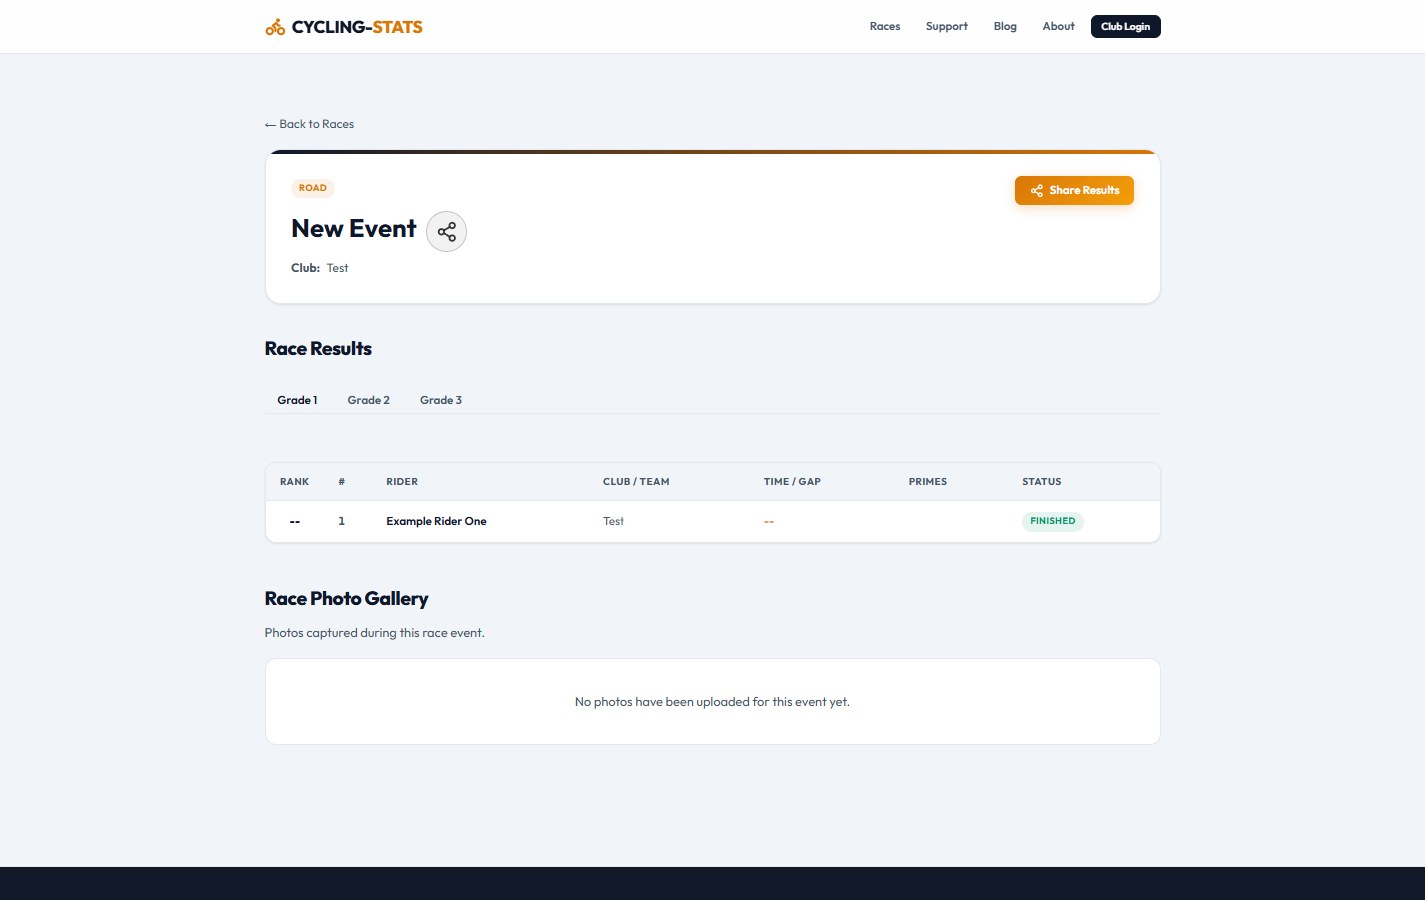
Results are entered per race: position, time or gap, points, primes, and a status for the DNFs. The event page then serves what the club used to email out — line-up by grade, results per race, live event standings, and the season standings with one breakdown column per race so you can see where the points came from, not just the total.
The rest is the unglamorous part that keeps it trustworthy: new clubs go through an approval step before they're public, accounts verify their email, two-factor auth is available on request, and Web Push notifications cover race-day reminders, new results, and club announcements. A club's number list lives with the club, not in a spreadsheet tab someone forgot to update.
Why it's free for clubs
The commercial question is obvious: SaaS race platforms price per athlete, per season, and at a 40-rider club that's real money coming out of a volunteer-run budget. This one runs on my own home server — Django, Postgres, Docker — so the marginal cost of another club is about zero. Free isn't a trial here: no card, no expiry, no "contact sales". What it costs me is support time, and for a sport I ride in that's a trade I'm happy to make.
It's one of my own sites, so treat the recommendation with appropriate suspicion. What I can vouch for is the shape of it: three core entities — riders, events, results — and everything else (standings, plates, imports, notifications) derived from those three. That's why it stayed maintainable through a full season instead of becoming the spreadsheet it replaced.
If you run a club
If your club is still on the spreadsheet, cycling-stats.com is free for clubs — bring a line-up CSV and your number list, and the first event takes an evening. The standings do themselves from then on.
If this was useful, More hands-on tech guides at TechGeek. No pressure — read it whenever it's useful.
